Monitoring in practice: does more data always mean better?
This case study shows the deployment of Zabbix and Grafana in my test environment based on Proxmox. The goal was not just to "set up the tool," but to understand how monitoring works operationally and what its real value is – both technical and audit-related.
Why was this project created?
Monitoring is often reduced to charts. In practice, it is one of the key elements of IT environment control.
- Understanding what data the system actually collects.
- Checking the impact of monitoring on infrastructure.
- Separating valuable metrics from noise.
Key conclusion: it's not about monitoring everything – only what matters.
Technology stack: Proxmox, Zabbix, and Grafana
Zabbix was deployed as an LXC container in the Proxmox environment using a ready-made installation script.
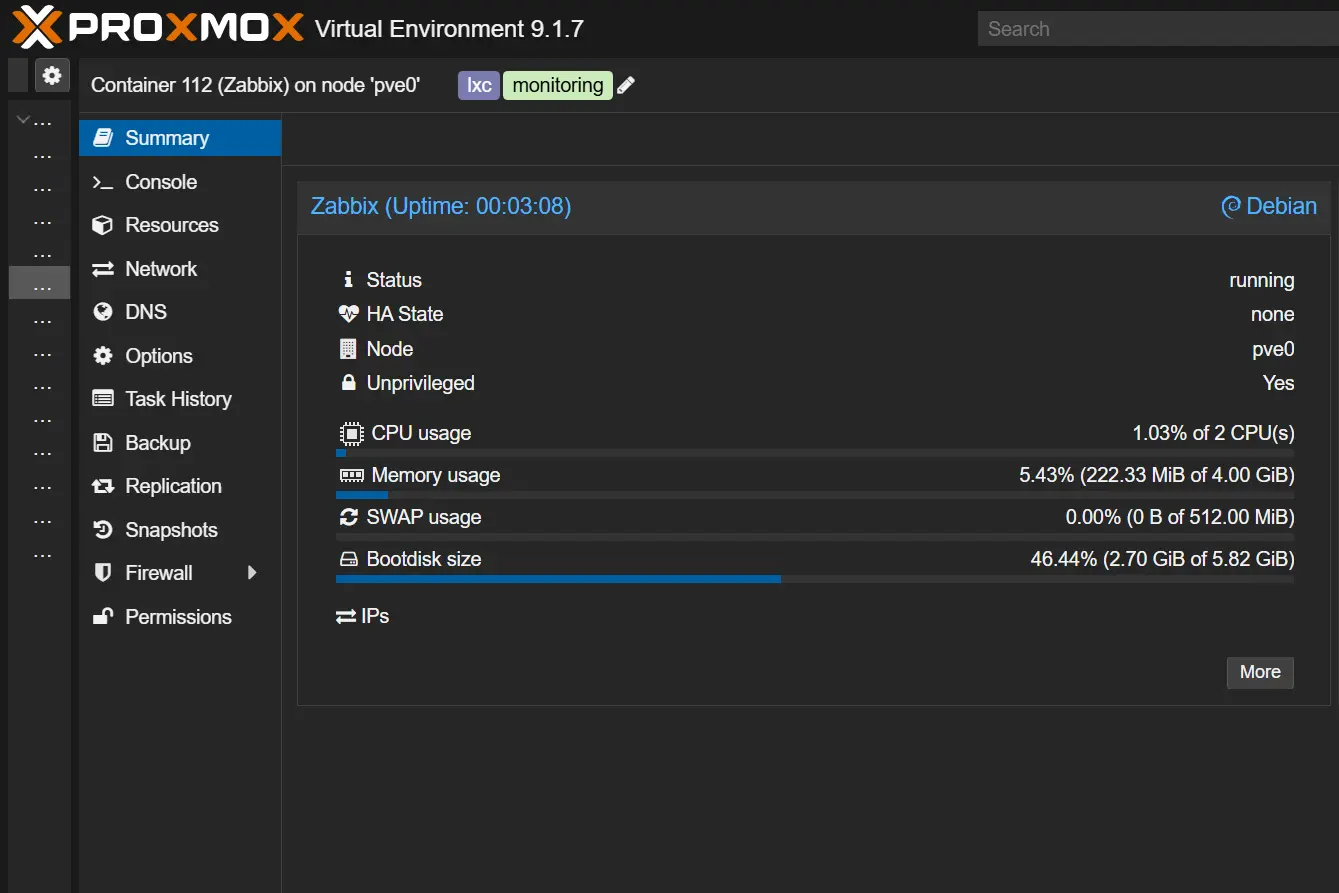
Zabbix as an LXC container – fast and lightweight deployment in Proxmox.
Test environment configuration
- Platform: Proxmox VE
- Zabbix: LXC container
- Grafana: separate container (integration via API)
- Resources: 2 vCPU / 4 GB RAM / ~6 GB disk
Zabbix acts as the central monitoring server, collecting data from agents installed on hosts – including the hypervisor and selected virtual machines.
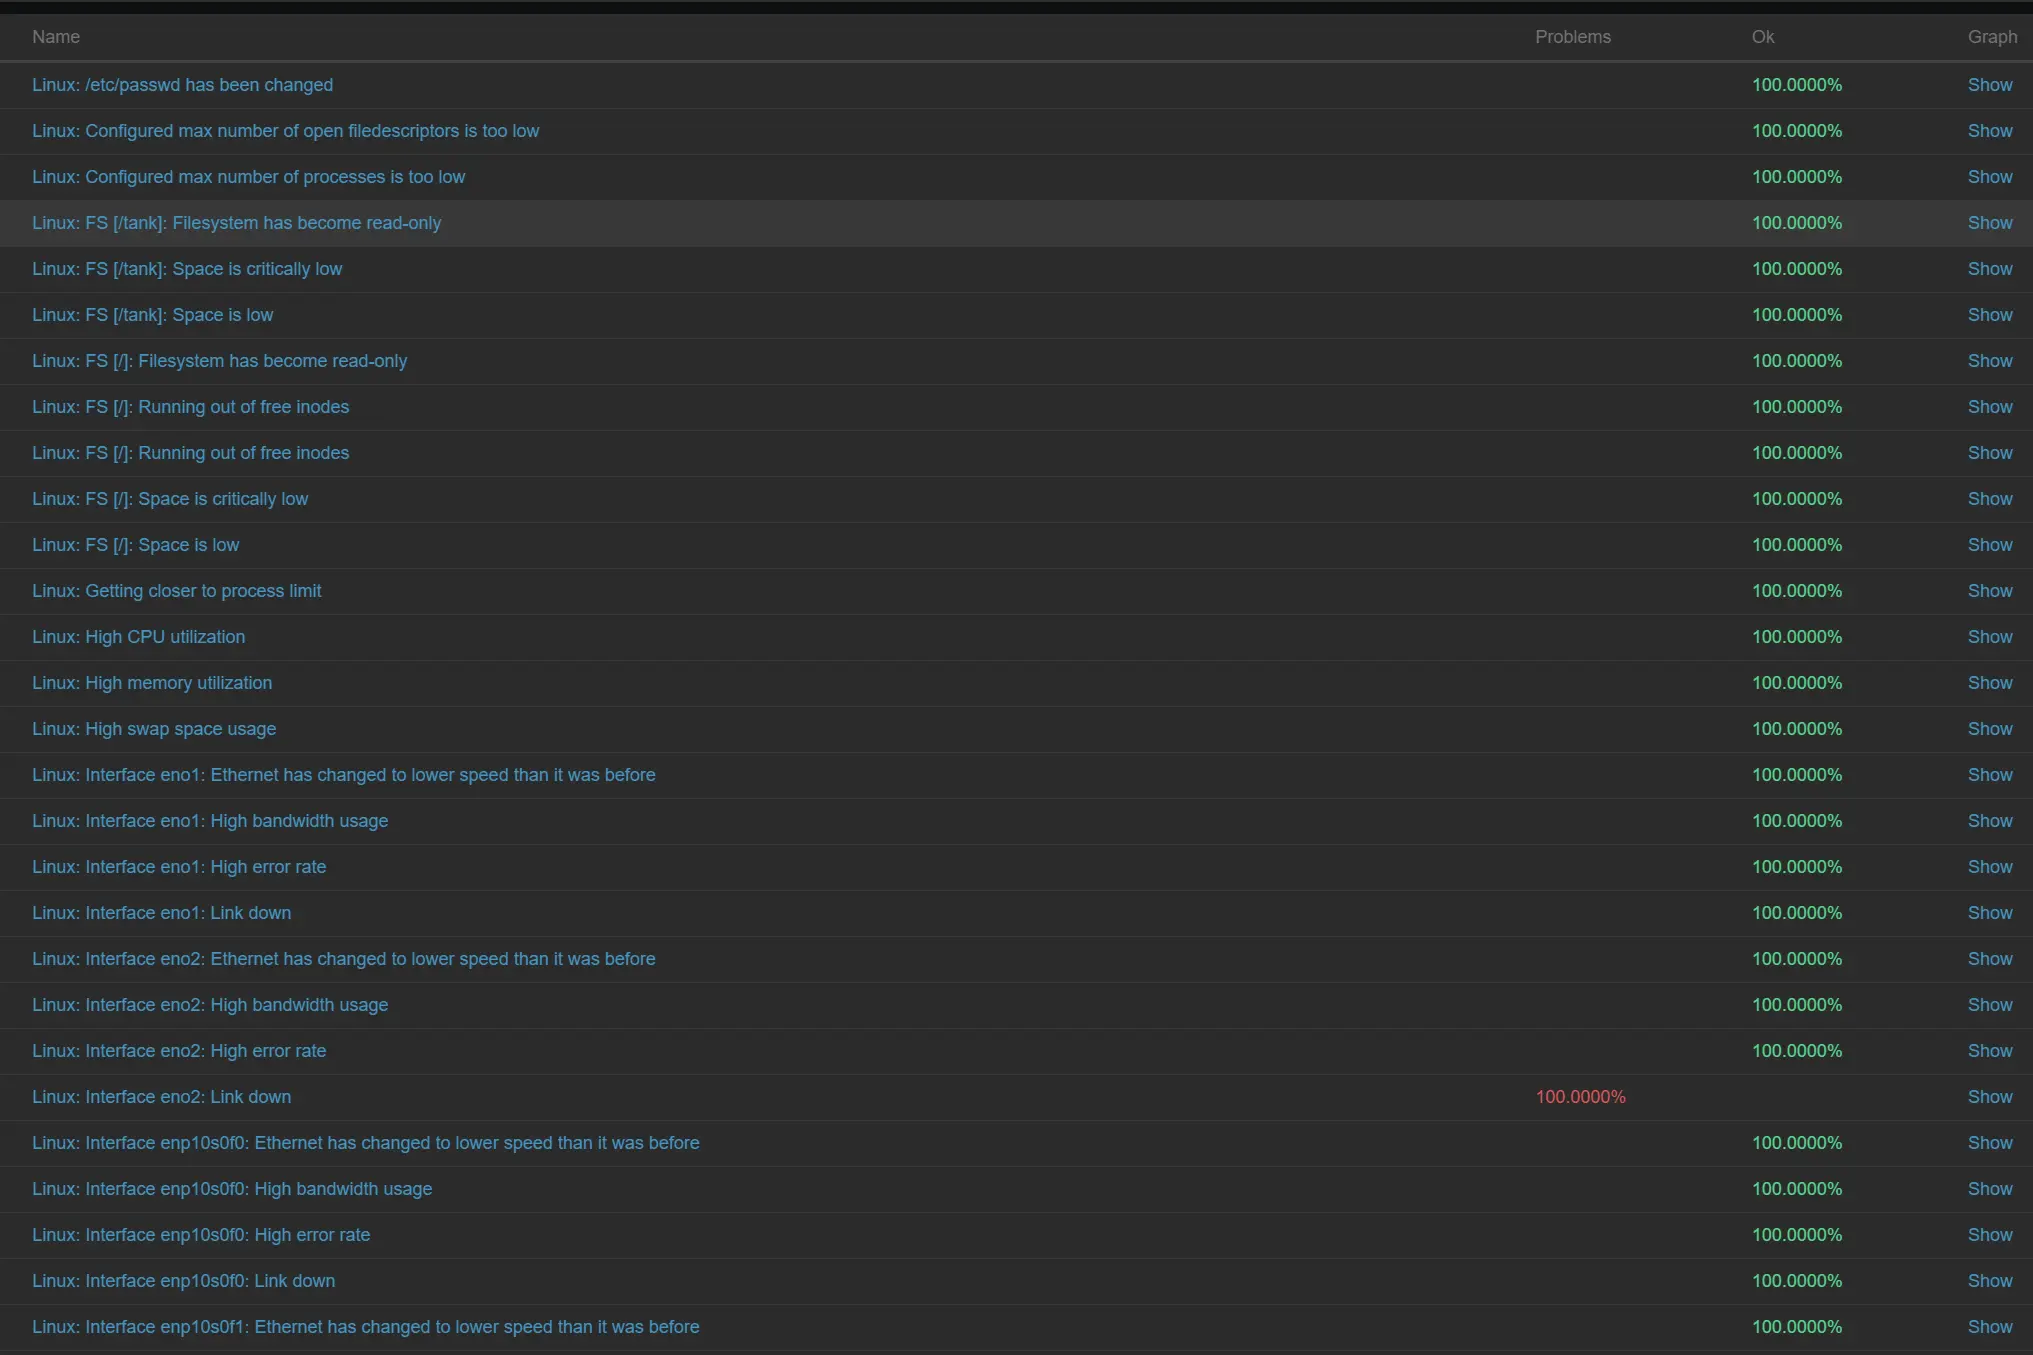
What did I actually monitor?
- CPU, RAM, disk
- Network and traffic
- Host status
- Hypervisor as a key element of the environment
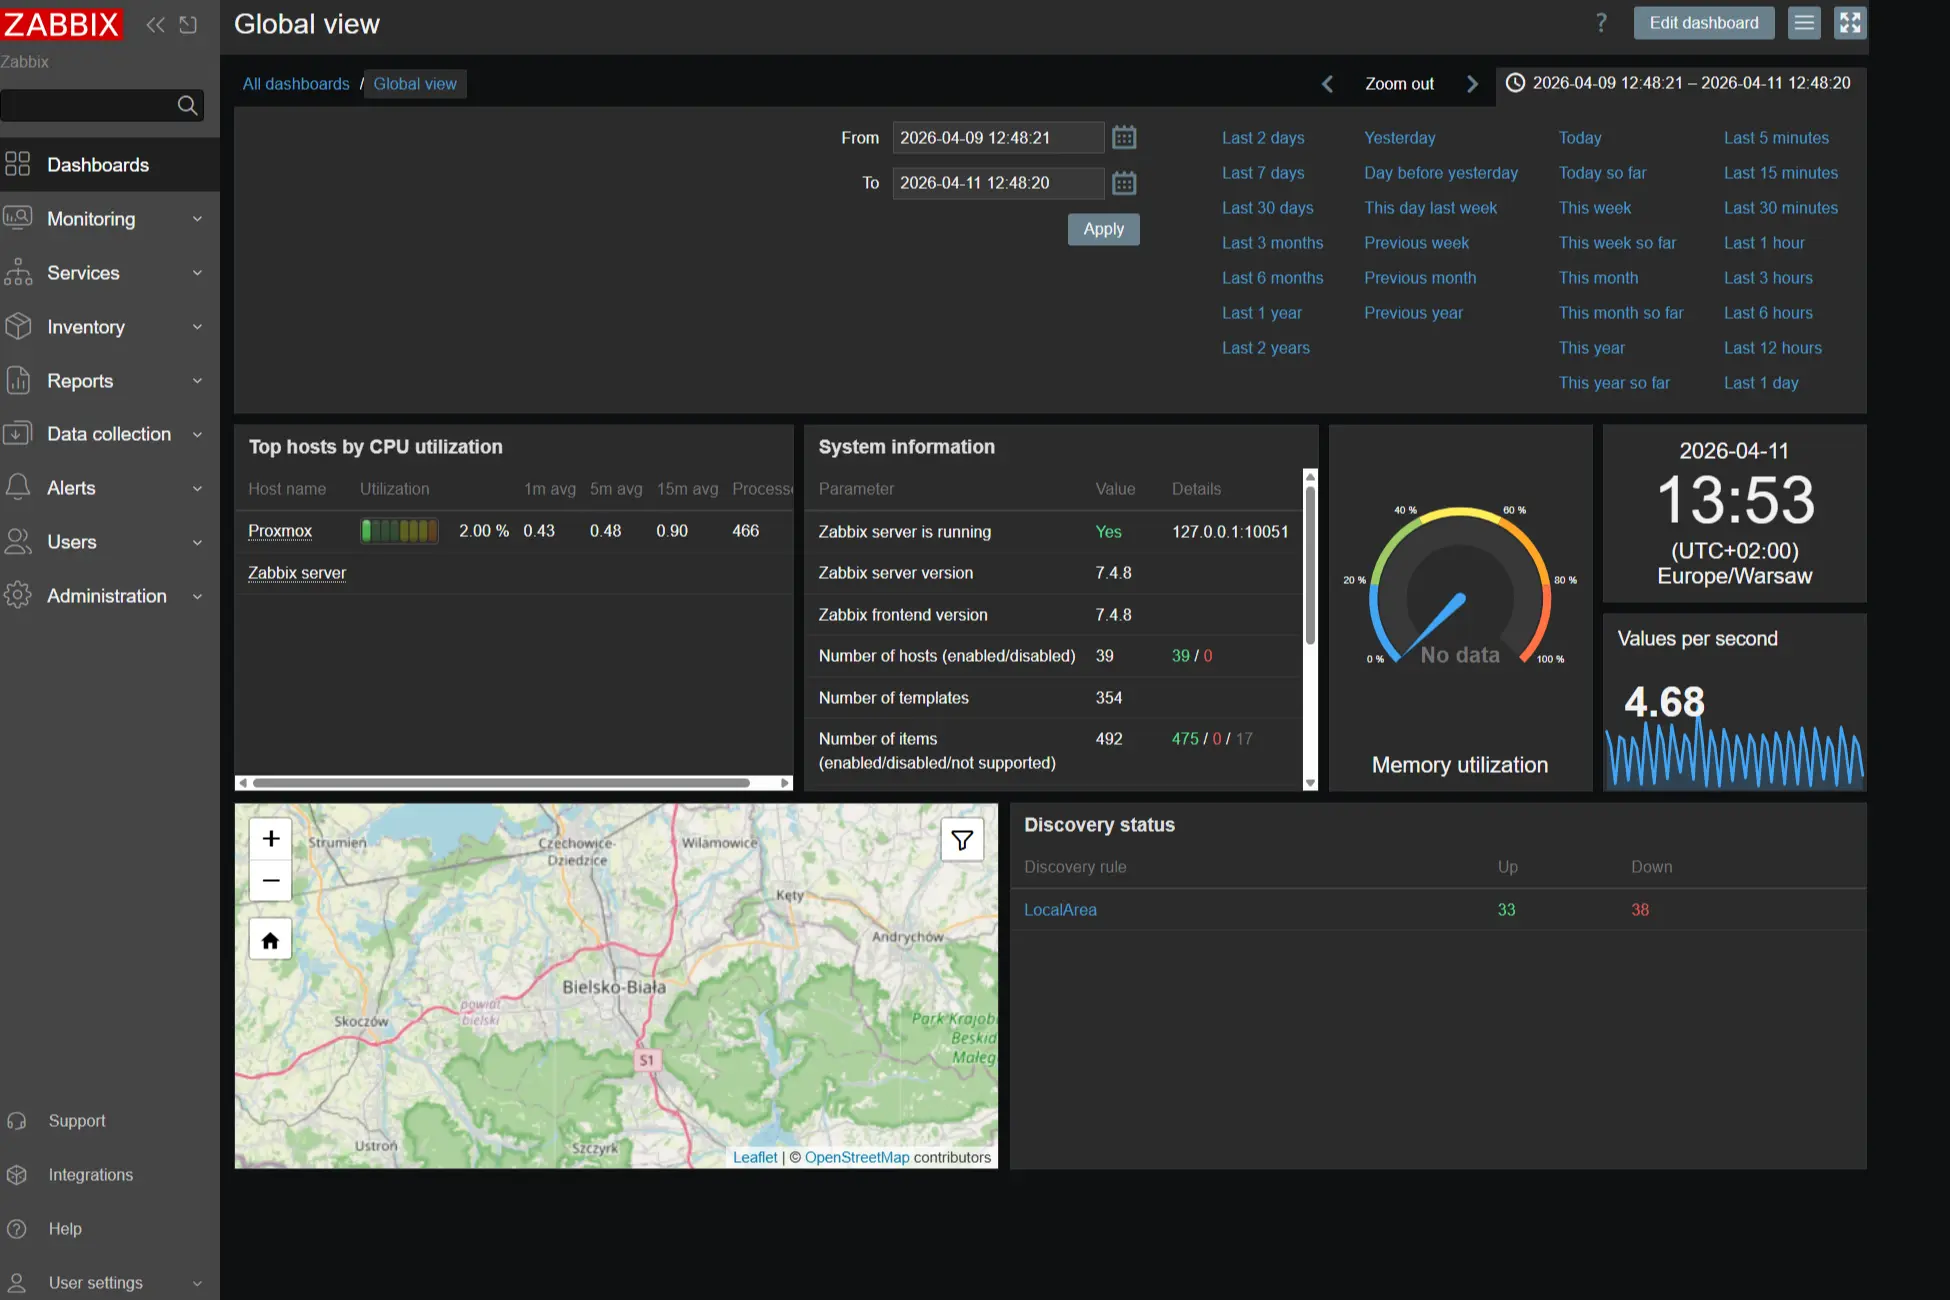
Zabbix Dashboard – host overview and basic metrics.
Visibility of all monitored hardware components – the foundation of environment control.
During the full network monitoring tests, a real problem emerged:
- increased network traffic,
- environment stutters,
- performance degradation.
Conclusion: Monitoring generates a cost – and not just infrastructural, but operational as well.
Therefore, ultimately, only key elements are monitored – primarily the hypervisor and selected machines.
The role of agents: without them, monitoring loses its meaning
The biggest difference is seen between systems with an agent and those without one.
Agentless devices (e.g., routers) provide limited data that does not allow for real analysis.
Conclusion: Without agents, monitoring is superficial and does not provide full control.
Grafana: interpretation instead of data
Grafana was deployed as a separate container and communicates with Zabbix via API.
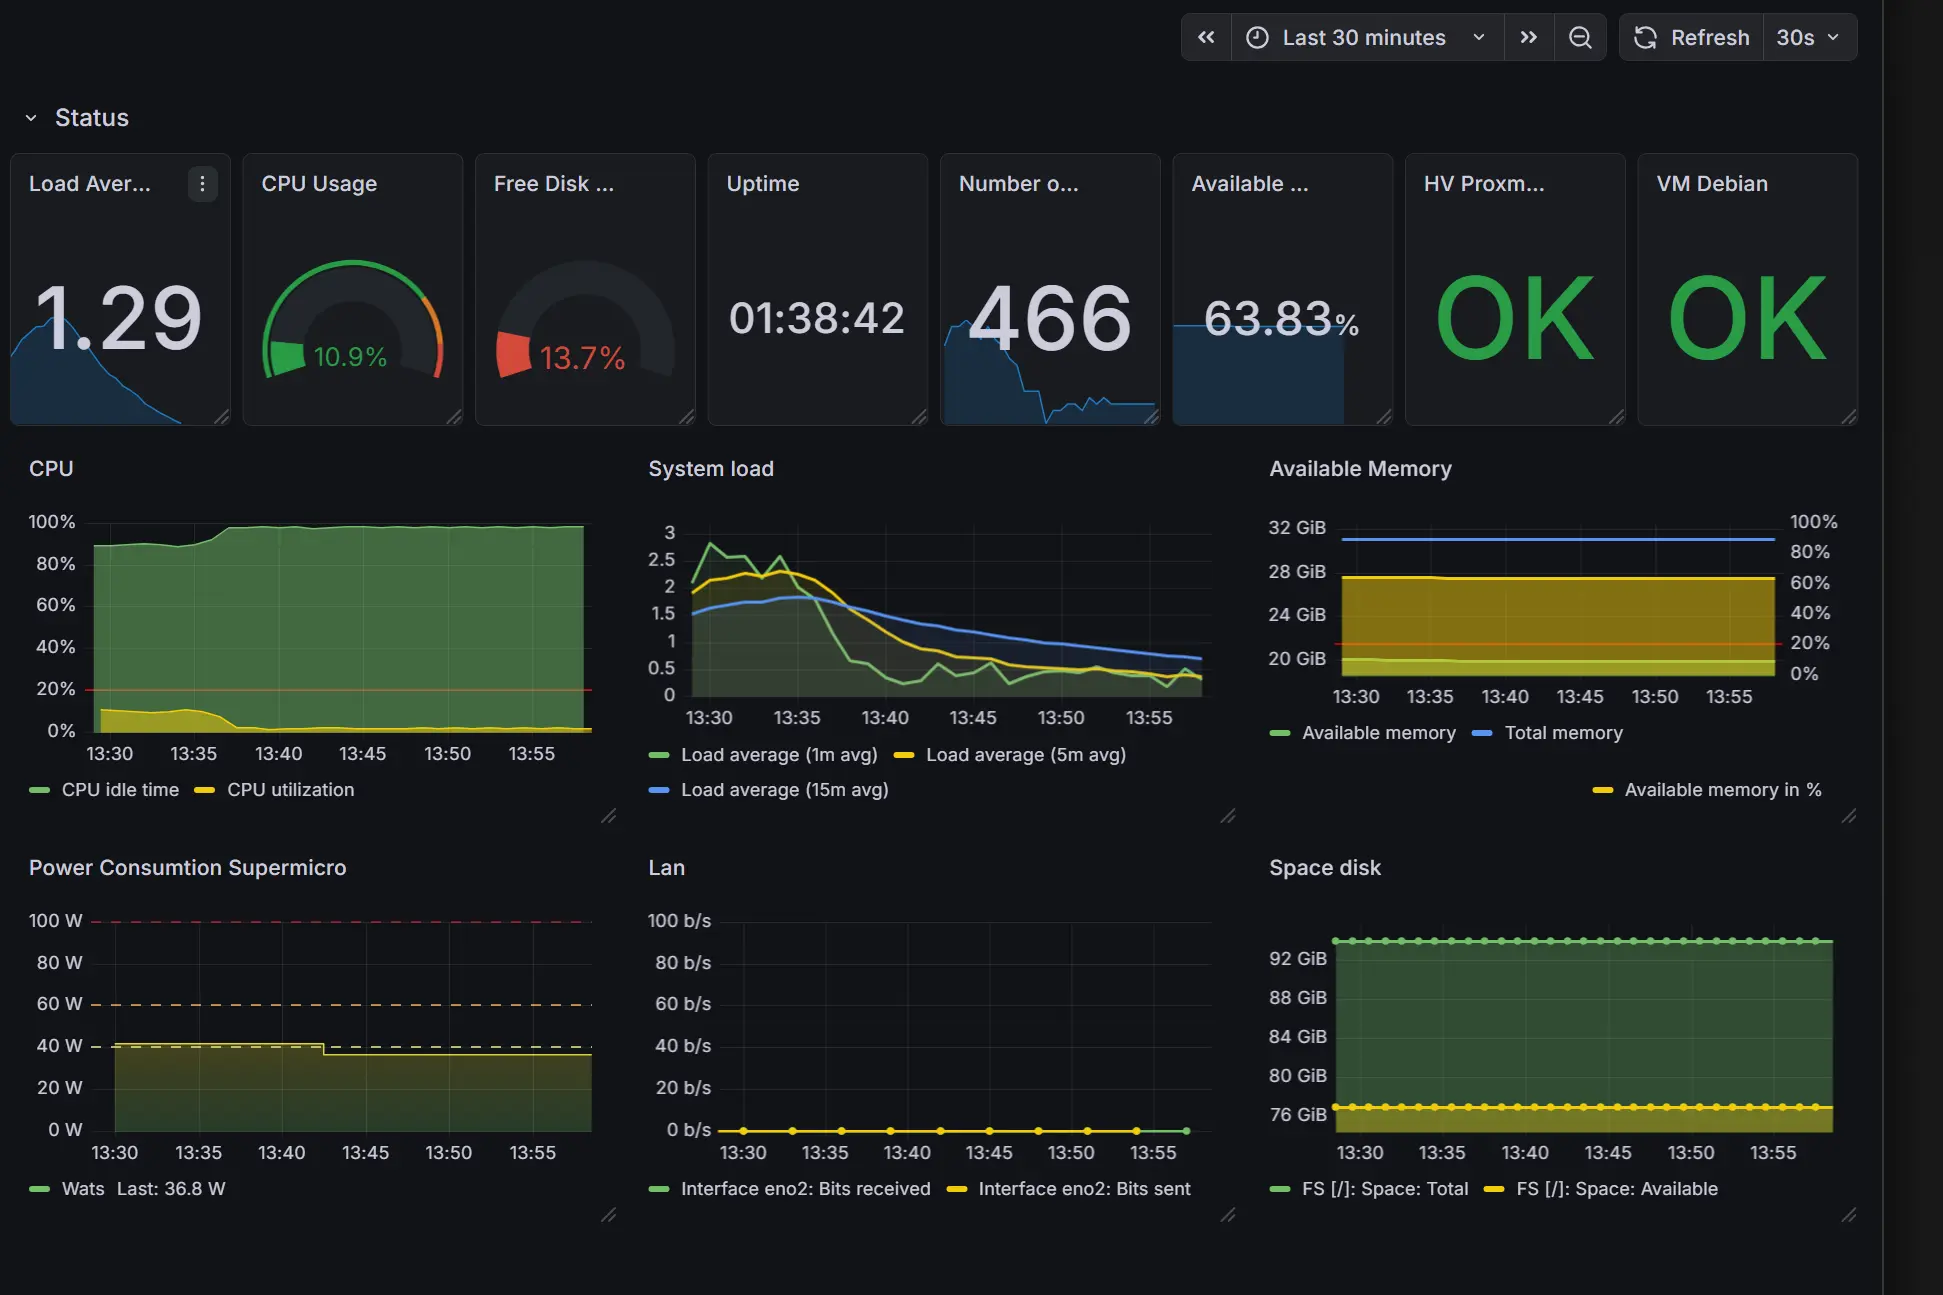
Grafana – data aggregation and rapid interpretation of the environment's state.
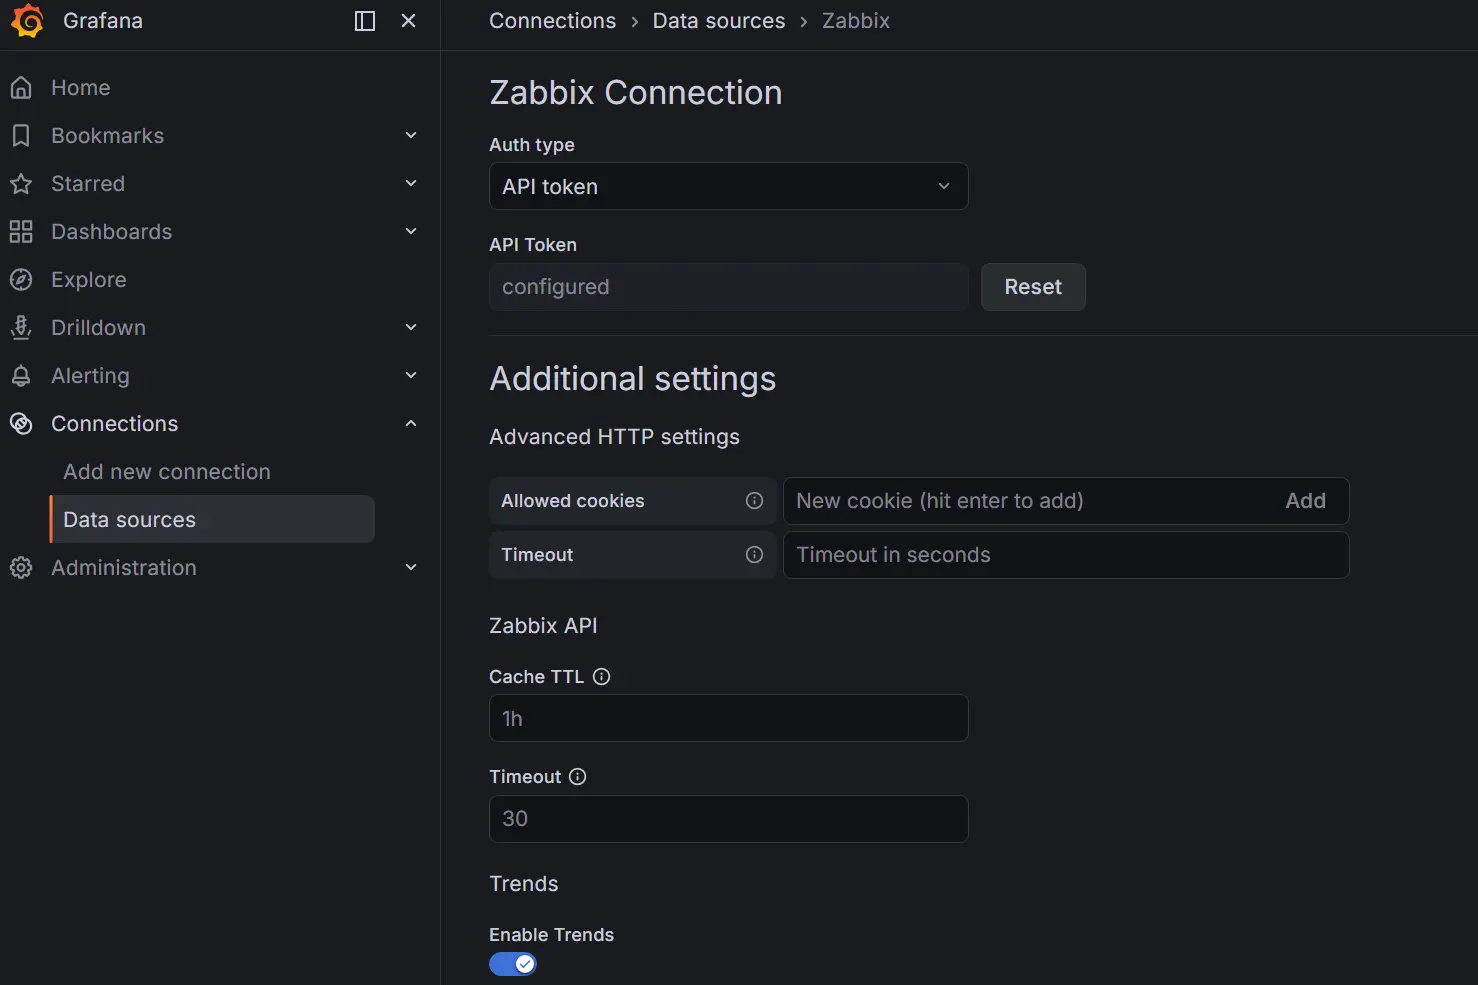
API Integration – separating the data layer from visualization.
Grafana doesn't collect data – it helps you understand it.
- clear dashboards,
- trend analysis,
- a single view of the entire environment.
The most practical value: the ability to see the entire environment in one place, without logging into each host individually.
Alerting – a conscious decision
Active alerts were not configured in this test environment.
Instead, the following were applied:
- resource utilization thresholds,
- visual monitoring.
This avoided notification fatigue and allowed focusing on observing system behavior.
Audit "Aha!": Monitoring and ISO 27001
- 8.6 Capacity management: Monitoring allows controlling resource utilization and planning infrastructure growth.
- 8.16 Monitoring activities: Full visibility of the environment and activities.
This implementation shows that the standard's requirements are not just "on paper" – they have very practical justifications.
Monitoring supports the standard only when it is thoughtful – not when it is maximal.
Monitoring Philosophy and Architecture
Implementing monitoring systems is often associated with a technological race for the highest number of charts. However, this project proved that the true value of monitoring lies not in the quantity of collected data, but in its quality and ability to support decisions.
The main goal of the implementation was to provide full visibility (observability) while maintaining optimal resource consumption. Instead of monitoring every available parameter, the focus was on Health Checks and Capacity Planning trends.
Key takeaway: Monitoring supports standards and security norms only when it is thoughtful – not when it is maximal.
Business Value and Monitoring Maturity
- Principle of Significance: The biggest mistake is assuming that "more data equals better monitoring." An information overload generates noise that hides real problems during a crisis.
- Performance: Every additional sensor has a cost. Rapid resource consumption (disk space, network load) necessitates precise definition of sampling intervals.
- Business Value: The greatest benefit is not colorful dashboards, but the ability to predict overloads before they affect system continuity.
Monitoring is not an end in itself – it is a tool for decision-making. A correctly configured panel (e.g., in Grafana) should immediately answer the question: "Is my system secure and efficient?", rather than just presenting raw numbers.
This implementation demonstrates that system standard requirements have very practical justifications: they help distinguish informational chaos from real control over technology.
Key project takeaways
- Biggest surprise: Implementation was simple.
- Biggest myth: More data = better monitoring.
- Biggest problem: Rapid resource consumption (disk, network).
- Biggest value: Visibility into overloads and trends.
- Without this, monitoring is pointless: Agents.
My test environment vs reality
| Aspect | My test environment | Organization |
|---|---|---|
| Scope | Selective (key hosts) | Full infrastructure |
| Monitoring | Manual and observational | Process-oriented and continuous |
| Alerts | Optional | Critical for operations |
| Goal | System understanding | Risk management and business continuity |
Summary
Monitoring is not about collecting data.
It's about making decisions.
This project showed one key thing:
it's not about seeing everything – but seeing what matters.
Q&A: Monitoring, Zabbix, Grafana
What is an API?
API (Application Programming Interface) is an interface that allows communication between different applications or system components. It enables automatic data exchange, for example, between Zabbix and Grafana.
What is an LXC container?
An LXC (Linux Containers) container is a lightweight operating-system-level virtualization method for running multiple isolated Linux systems on a single host. It enables fast and efficient deployment of services like Zabbix.
What is Zabbix?
Zabbix is an open-source IT infrastructure monitoring system used for collecting, analyzing, and visualizing data regarding the status of servers, networks, applications, and services.
What is Grafana?
Grafana is a data visualization tool and interactive dashboard builder. It allows for trend analysis and quick interpretation of the IT environment's state, integrating with sources like Zabbix.
What is infrastructure monitoring?
Infrastructure monitoring is the process of continuous collection and analysis of IT system status data, aimed at rapid problem detection, resource optimization, and ensuring business continuity.
Why use an agent in monitoring?
A monitoring agent is software installed on the monitored device that collects detailed data about its state and transmits it to the monitoring system. Without an agent, visibility is limited.