



Purpose and scope of my deployment
I carried out this project in my private Proxmox VE lab. It was a test of my ability to deploy monitoring and prepare visualisations, as well as an opportunity to understand how my own infrastructure behaved.
I deployed Zabbix as an LXC container using an existing installation script. Grafana ran in a separate container, integrated with Zabbix through its API. The scope covered the hypervisor and selected virtual machines.
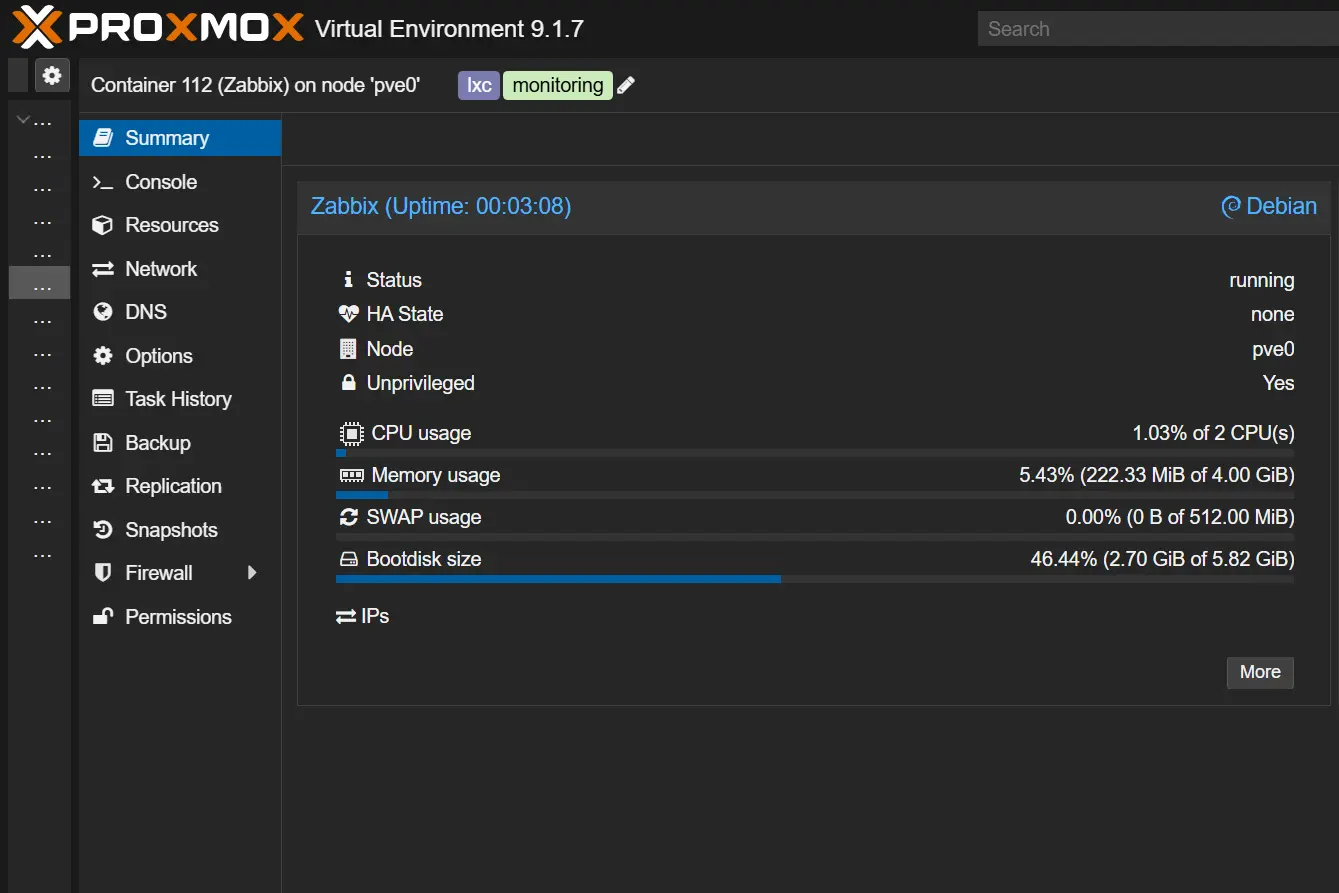
Zabbix as an LXC container in the private Proxmox environment.
Monitoring scope follows the importance of resources
I was interested in server resource metrics, network traffic and the availability of selected virtual machines. I chose the scope based on each component’s importance to the operation of the lab.
I take a similar approach to larger environments: identify key services and the consequences of their unavailability first. Then select the data, observation frequency and need for alerting. A parameter being available in a tool does not, by itself, make collecting it necessary.
Key services need up-to-date status information. Where a prompt response is needed, appropriate notifications should also form part of the scope.
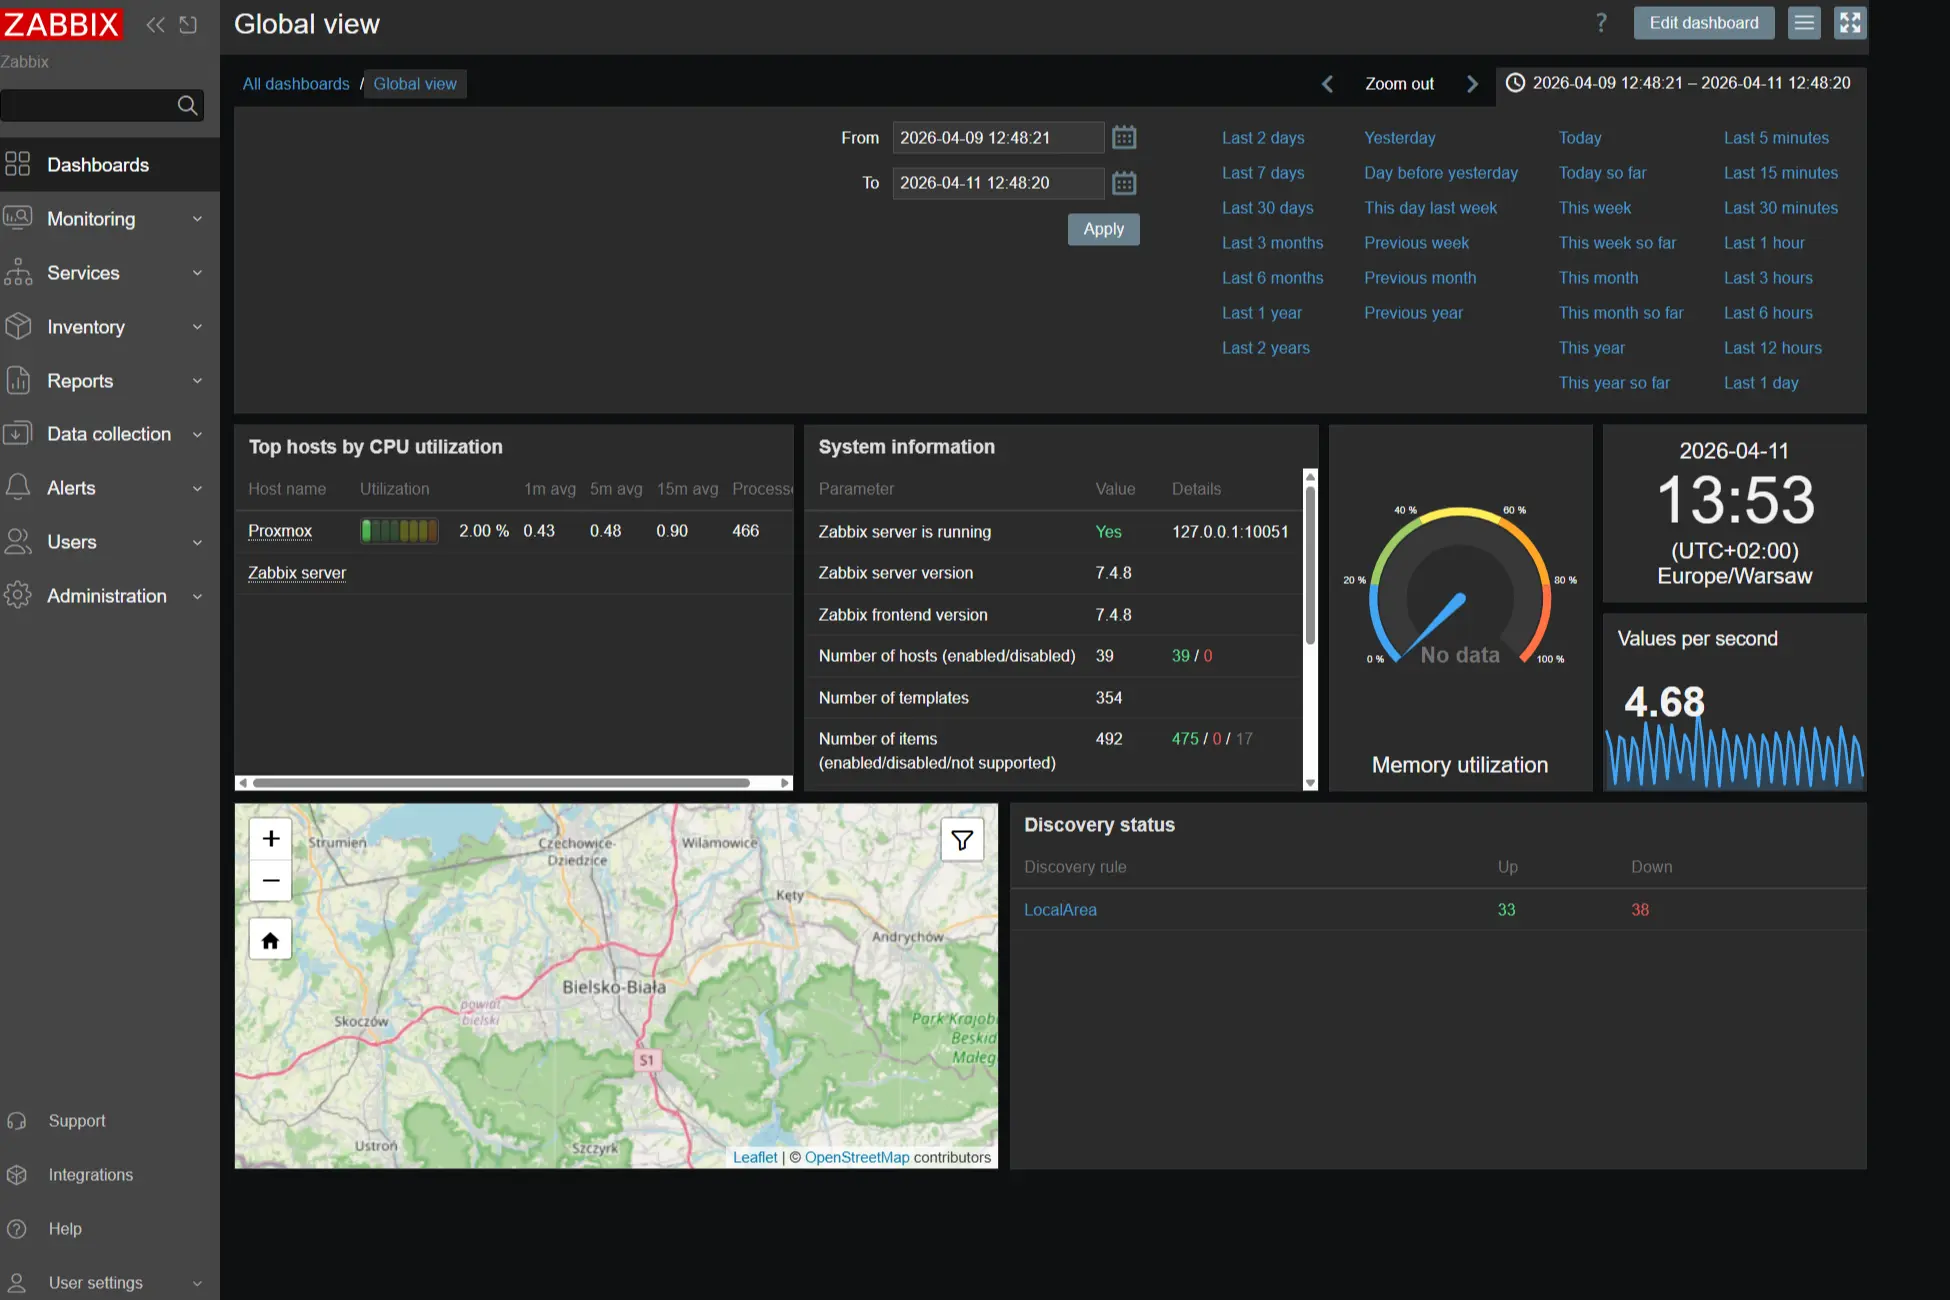
An overview of monitored hosts and selected metrics in Zabbix.
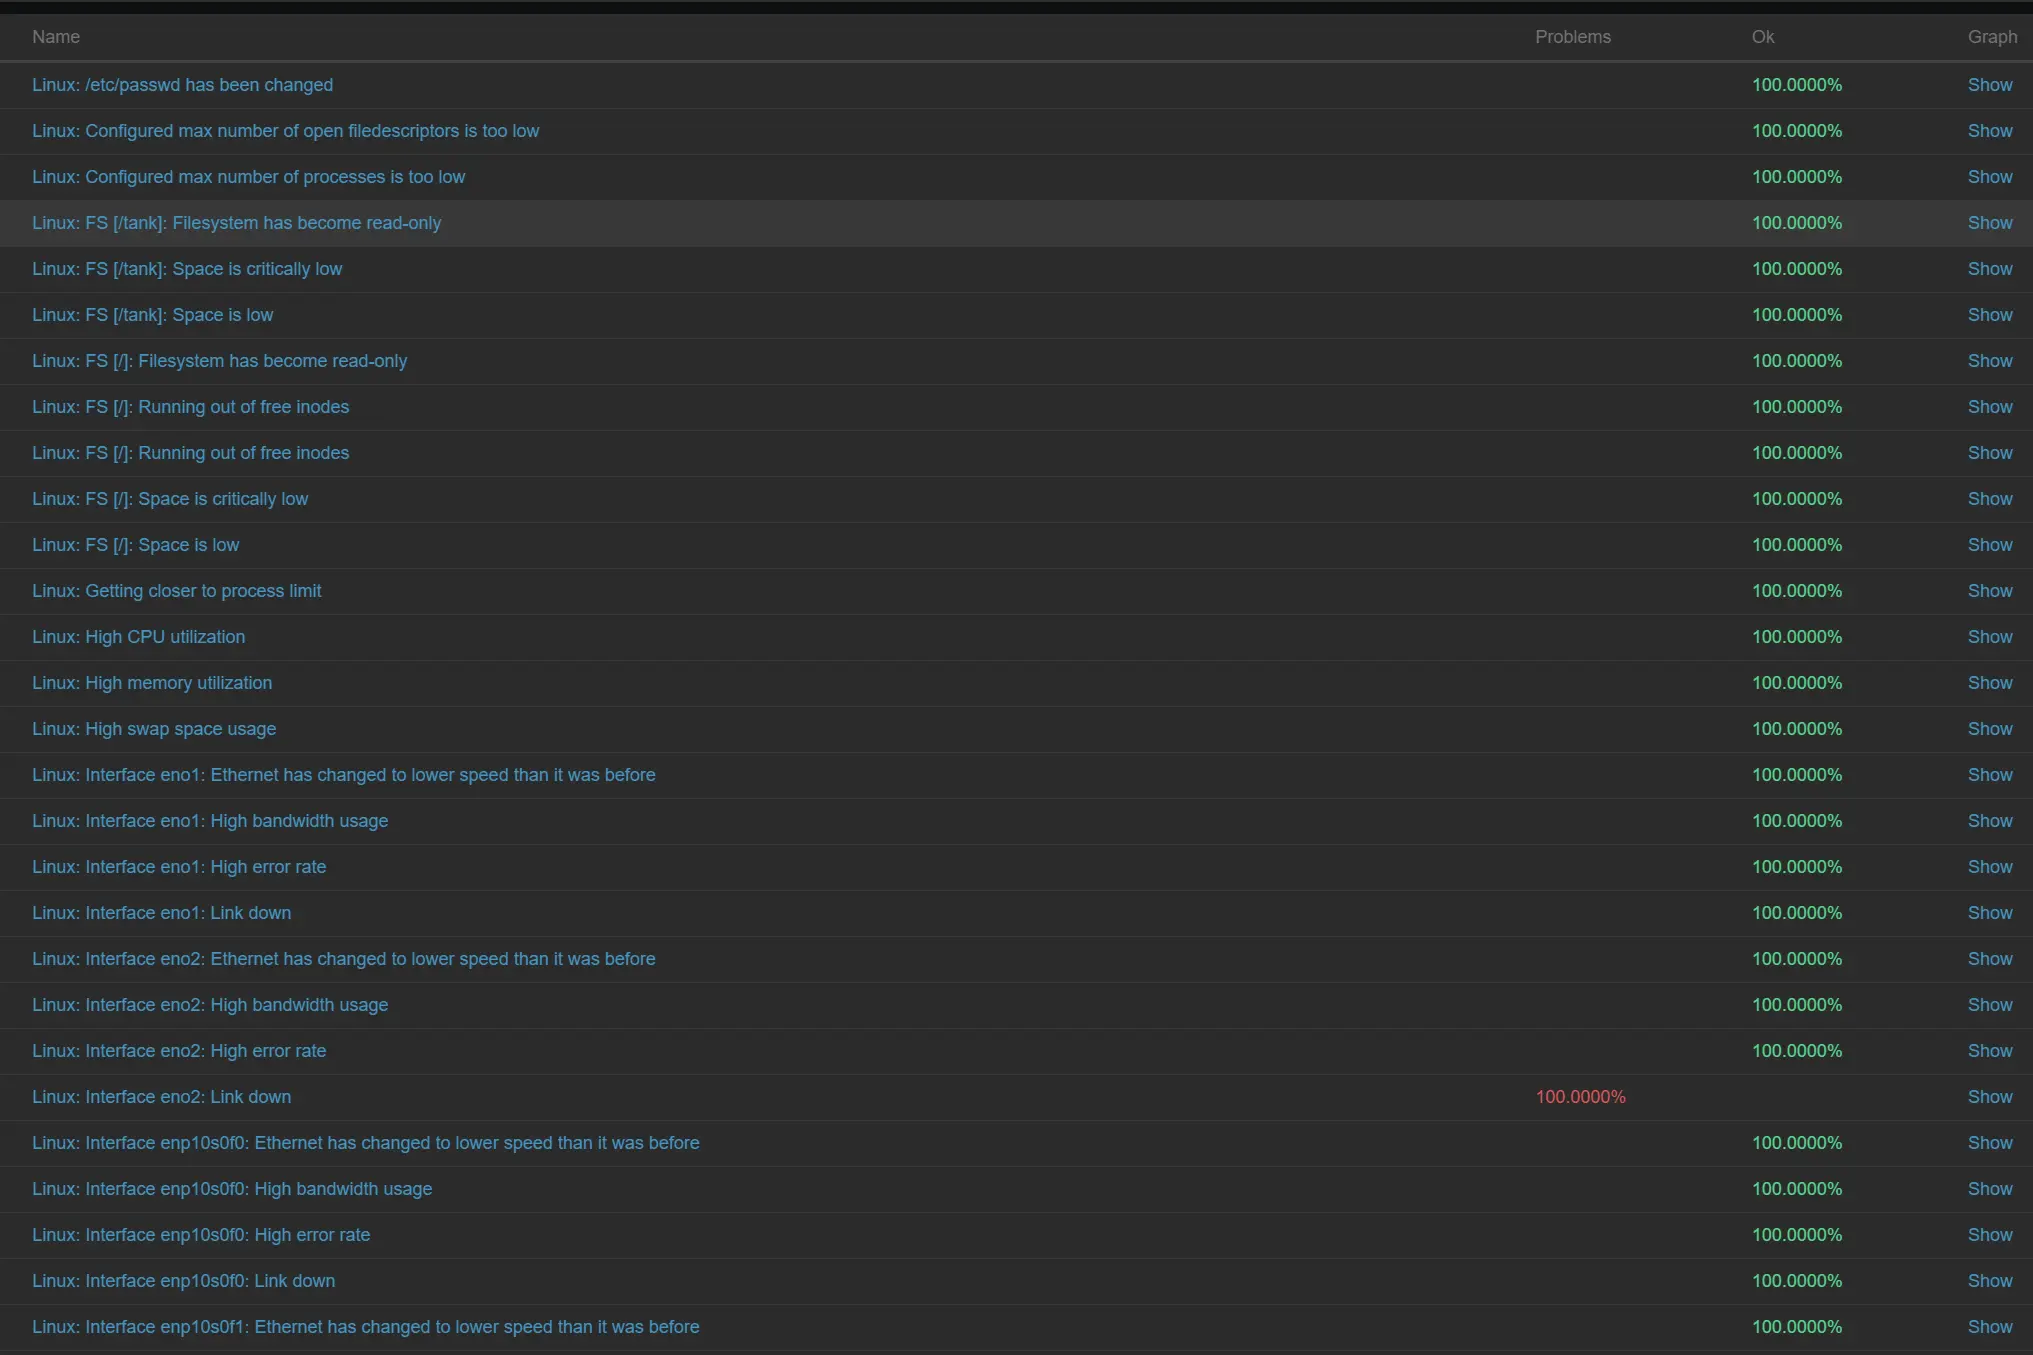
Availability view for monitored hosts in Zabbix.
Grafana - a clear view of selected data
Zabbix provided resource monitoring. In Grafana, I wanted to create an attractive, accessible view tailored to what I needed to observe. My aim was to bring the most important information together on one dashboard.
I achieved that goal. A shared view made it easier to review selected metrics without switching between separate screens. For me, clarity was part of the solution’s usefulness: the data needed to help me understand the situation and decide what to do next.
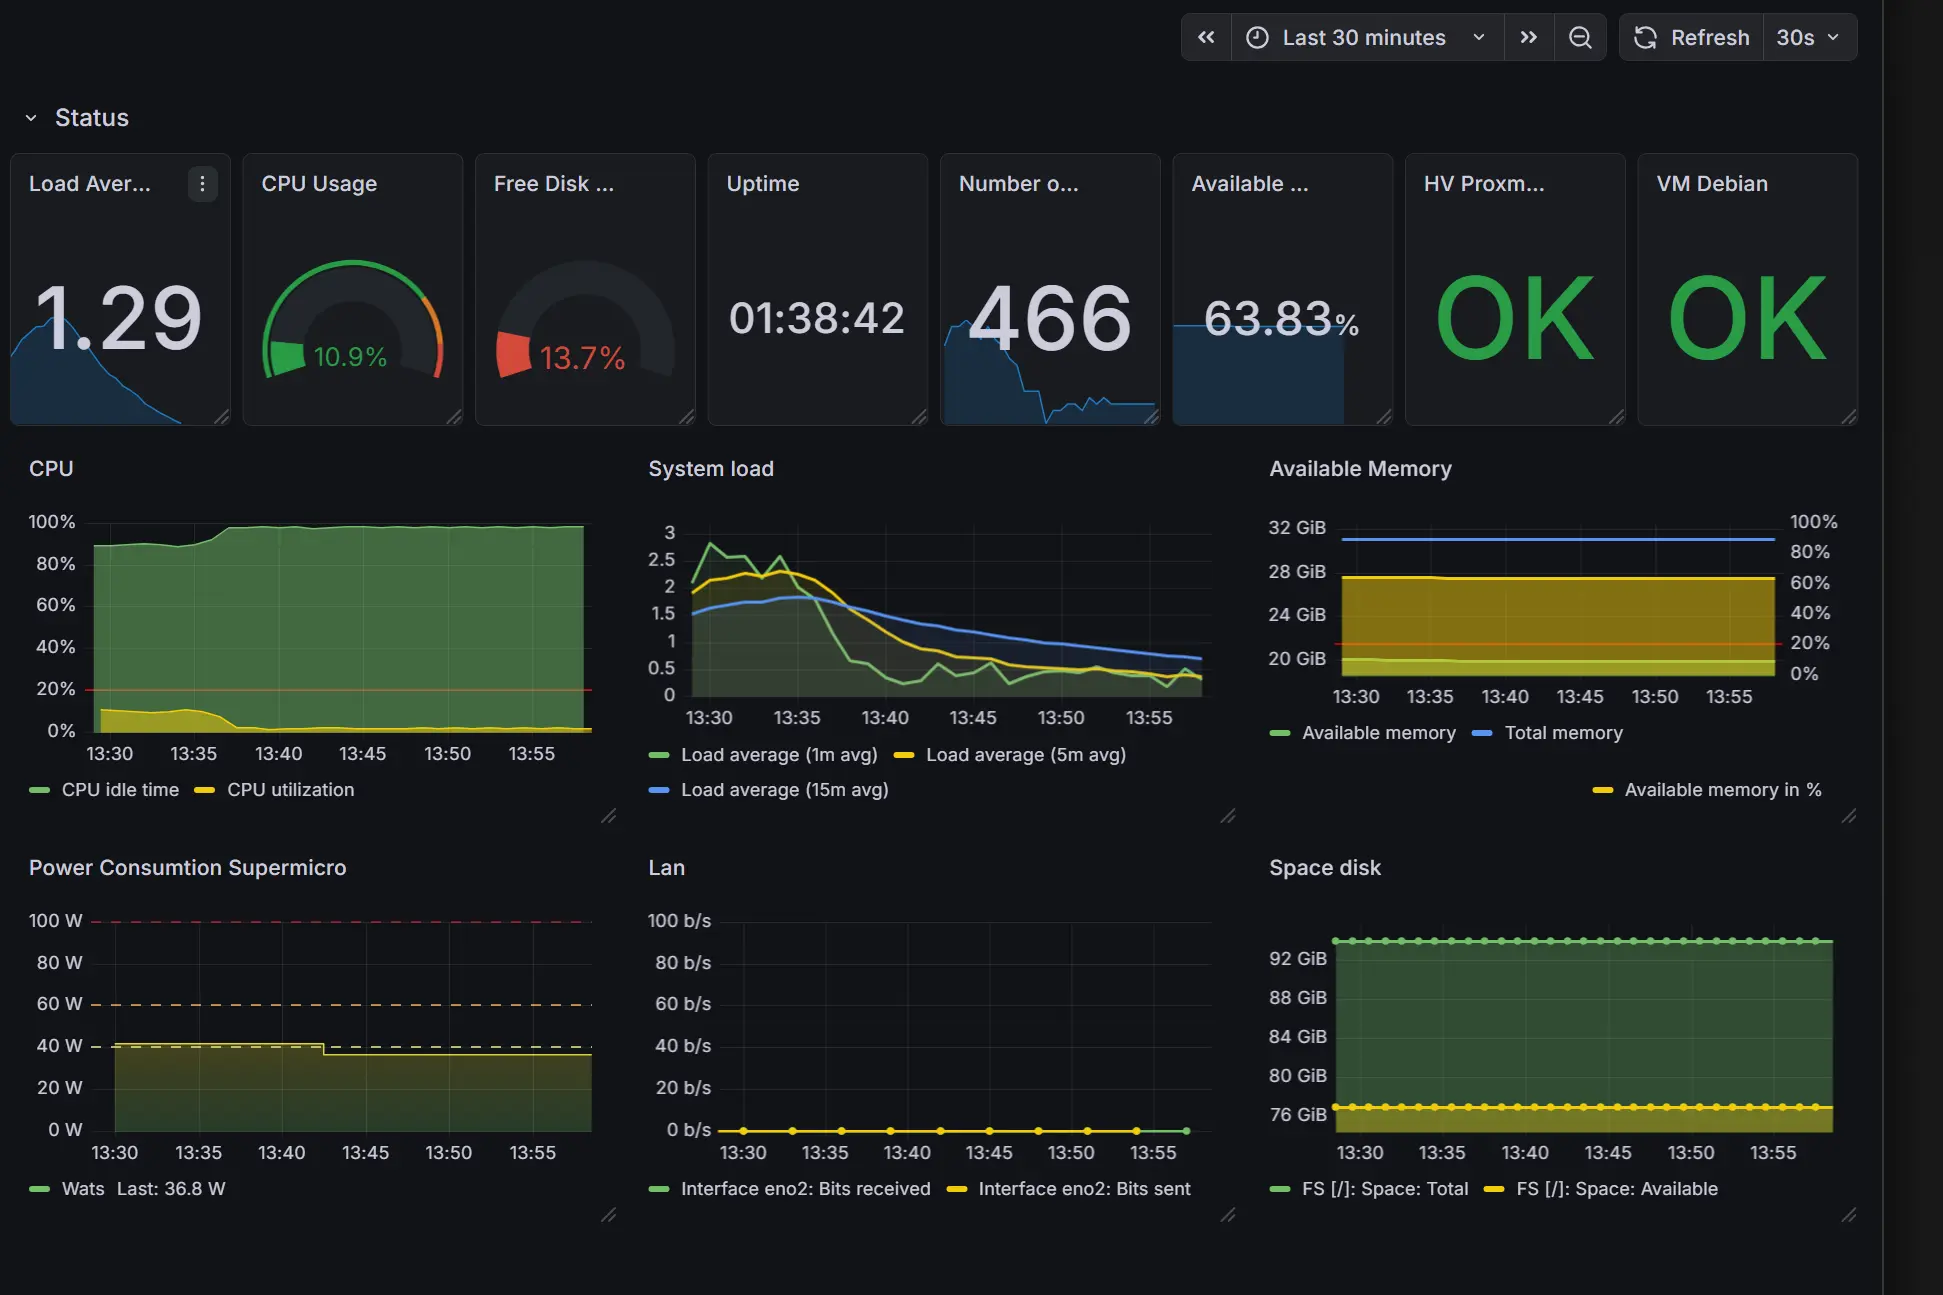
A shared Grafana dashboard showing selected monitoring data.
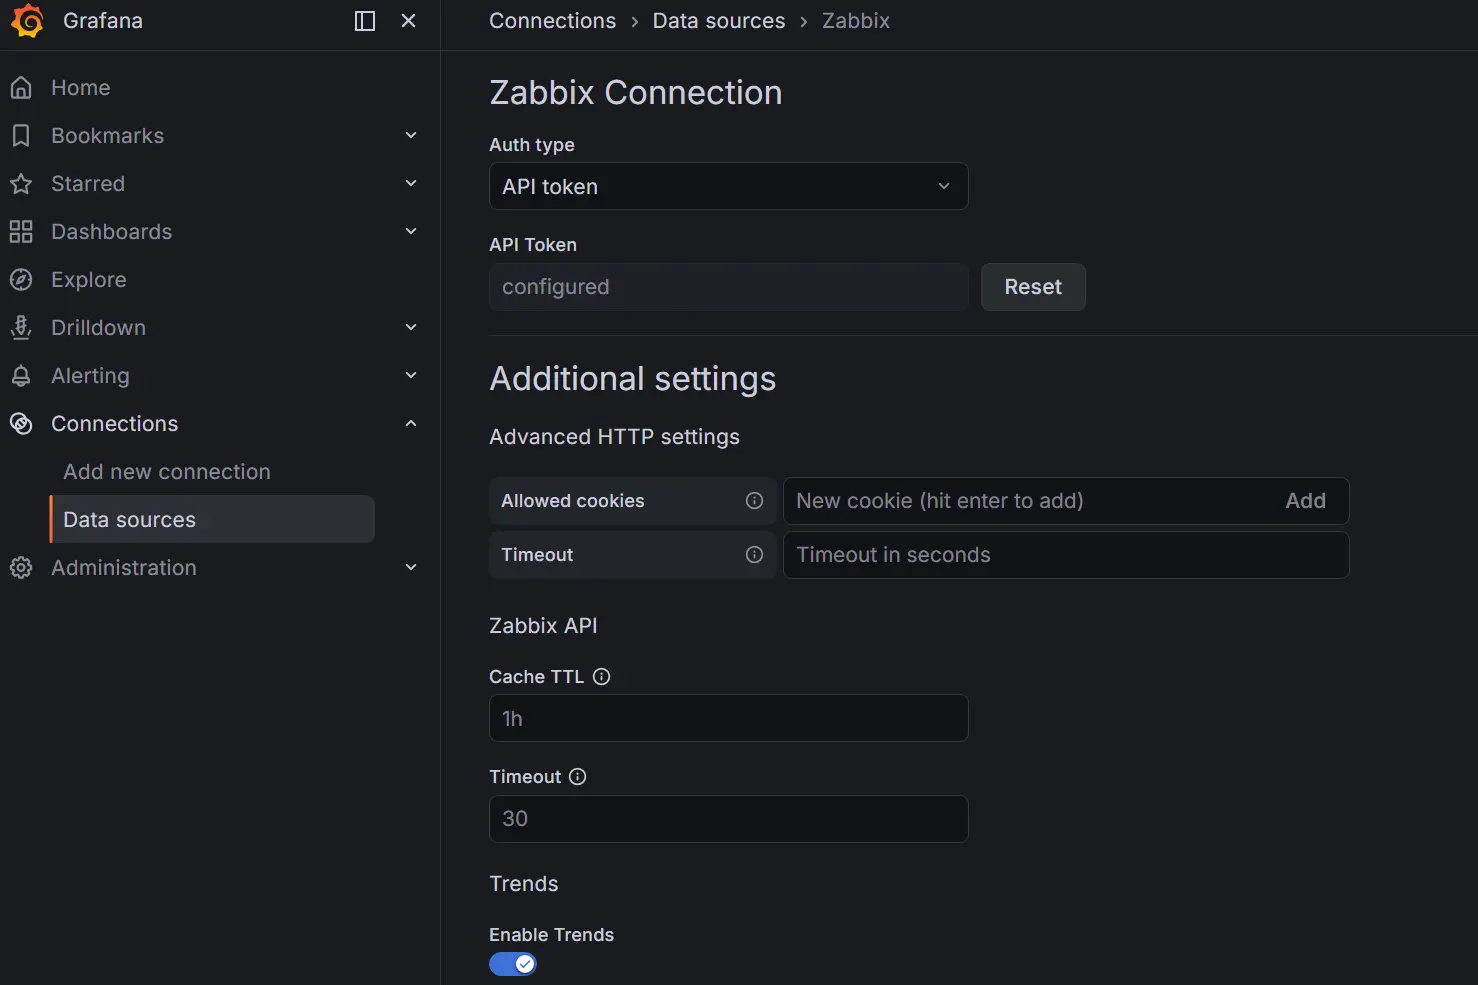
Grafana integration with Zabbix through its API.
What observing the environment revealed
I observed increased network traffic during backups and network scans. This was a practical example of why maintenance activities need to be planned with load in mind, even in a small environment.
The lesson concerned the timing and scope of these activities, particularly when they could run simultaneously. I do not treat this observation as proof that monitoring itself caused an overload. A recorded change is a starting point for assessment; identifying the cause requires considering what the environment was doing at the time.
From observation to automation and optimisation
Monitoring helped me make further improvements to the lab. One change was to automate the server’s operating cycle: starting up, performing backups and shutting down. The server does not run around the clock because its role in this environment does not require that availability.
Limiting energy consumption was a consideration from the beginning of the server’s design. I also worked on power management settings during operation, using PowerTOP diagnostics as a supporting tool. Operating time and power settings were two complementary areas of improvement.
Why I did not extend notification handling
I did not configure active notifications in this deployment. Given its small scale, experimental purpose and scheduled server operation, observing the data was sufficient for my needs.
I would not automatically apply that choice to an environment requiring continuous availability. Alerting needs should be linked to service importance, acceptable response time and responsibility for action.
A lesson from an audit perspective
After this experience, I would ask the monitoring process owner whether all applications, systems and servers considered critical were covered. If some were outside the scope, I would want to know whether the decision followed a risk assessment and how it was justified.
I am interested in the connection between the need, the scope of observation and the use of data. Deploying a tool alone does not establish whether the organisation is observing what matters to it.
Results and limitations
I deployed monitoring for selected resources and a shared dashboard. Observing the environment supported further improvements, including automation of the server’s operating cycle and work on power management.
This describes a private test environment. It does not present measurements of alerting effectiveness, production availability or a controlled comparison of energy consumption. The conclusions relate to this project’s purpose and scope.
Application to business
In an organisation, monitoring scope should reflect the importance of services to business processes. The starting point is to establish what must remain operational, what the consequences of unavailability would be and who should respond. I would then use that understanding to select metrics, thresholds and notifications.
A clear dashboard can help both technical staff and process owners assess the situation. Its value depends on whether the information supports a decision: investigating the cause of a deviation, planning resources or adjusting the maintenance schedule.
Automating the server’s operating hours in my lab illustrates a broader principle: resource availability should match actual needs. In a business, that decision requires consideration of dependencies, operational continuity and risk. Some services must run around the clock, while others can operate within defined windows. Monitoring provides data to assess where an improvement is justified.
Summary
The most important step for me was moving from deploying tools to using observations. Zabbix provided insight into selected resources, Grafana helped present the data clearly, and subsequent decisions addressed how the infrastructure operated. This is the value of monitoring in this project: data helps assess the situation and choose a justified improvement.
Sources and documentation
Questions and answers
Did the project cover the entire infrastructure?
No. The scope covered the hypervisor and selected virtual machines. The selection reflected the needs of the lab and the importance of the components observed.
What role did Grafana play?
It presented selected Zabbix data on a shared dashboard. The aim was a clear and attractive presentation of the information needed to observe the environment.
Is backup automation a function of this dashboard?
Automation of the server’s operating cycle was a separate lab improvement. This description does not attribute its execution to Zabbix or Grafana.